Showing posts with label research. Show all posts

Wednesday, February 5, 2014

Healthcare Reform is working as planned, with good reason, as it will reduce the (slave/forced) labor force by 2.5 million


 Health Care Law Projected to Cut the Labor Force

WASHINGTON — A Congressional Budget Office analysis released Tuesday predicted that the Affordable Care Act would shrink the work force by the equivalent of more than two million full-time positions.   NY Times 

No, CBO did not say Obamacare will kill 2 million jobs

The Fact Checker had to repeatedly explain that the Congressional Budget Office never said that the Affordable Care Act “killed” 800,000 jobs by 2021. Now, the CBO has released an updated estimate, nearly the triple the size of the earlier one: 2.3 million in 2021.   The Washington Post. FACT CHECKER: The Truth Behind the Rhetoric


Healthcare Reform is working as planned and it's fantastic news for our country and our people.  The CBO (congressional budget office) projects that 2.5 million full-time positions in the next ten years.

Because workers will CHOOSE NOT TO WORK FULL-TIME.

In my educated opinion, this is a totally healthy choice from a mental health and self-care perspective.  So many people feel forced to get and keep jobs that they don't want, are bad for them, and don't even need to be full-time positions.  Probably a third of full-time job hours are spent by employees not working, simply because they have to be there, it's a stable job, and they can't afford to leave the job because they need health care and so do their children and/or spouses.

That's one of the purposes of this reform measure, to reform the system away from this quid-pro-quo situation that is simply taken for granted now.  FT work means benefits and a salary, and that also lots of times means working over-time for no extra pay.  We want people to HAVE more choice so that they AREN'T tied to their jobs because they need healthcare and insurance!

Corporations and the power-brokers in Washington want you to have less choice and to keep you as a slave to their needs.  Opponents of the ACA, who derisively call it Obamacare (namely GOP Republicans) will spin this as bad for "business" and the economy and for people in general.

But, it's fantastic for everyone - individuals, families, children, for the job market, especially job seekers, and anyone who values being able to have control over their own lives.  Congratulations, Americans, we are finally doing what's right and best for us.  Let's keep it up!

Tuesday, December 11, 2012

News: ADHD Can Cause Lifelong Problems, Study Finds - US News and World Report

ADHD Can Cause Lifelong Problems, Study Finds


Attention-deficit/hyperactivity disorder that persists into adulthood may affect physical and mental health


If children with attention-deficit/hyperactivity disorder, or ADHD, continue to have the condition in adulthood, a new study suggests that they may face an array of physical and mental health issues.
The study, which spanned more than 30 years, found that people who had ADHD as teens and adults face a greater risk of stress, work problems, financial troubles, physical health issues and additional mental health issues, such as depression or antisocial personality disorder.  
They also had difficulty in terms of work and experienced a great deal of financial stress.  82 percent higher odds of having impaired physical health. They were also more than twice as likely to have another mental health problem
 The study included 551 children. Seventy-two of those children were diagnosed with ADHD in 1975 when they were between the ages of 14 and 16. The researchers followed up with the children as they grew, and the final of five outcome surveys was given at an average age of 37.

ADHD Study - US News and World Report 

Wednesday, April 25, 2012

Community Engagement Model Development plans

So, I want to spend some time learning about community engagement.  Since I began this final internship of my graduate education, this seems to be a huge part that's missing in community change efforts.  I want to know what I can learn from the research out there - what are well-researched methods? what are best evidence-based practices? what "should" we be using in our change projects? when is best to poll the community?  in the beginning, before we start, as a check-up on progress, to gain satisfaction rating on the job we're doing, in the end as an evaluative measure?  ALL OF THE ABOVE?  How can we partner with communities and their members, the people who are actually affected most by these changes, and the ones who probably know best (despite our best efforts at studying them)?  How can we act as community members' consultants, instead of what usually happens that we end up doing things to them?

Below is a mind map of some of the thoughts I have on the issue, and where I want to go with these ideas.  Ultimately, I'd like to continue the work that I'm doing at my internship -- collaborating with other community planning staff on unique ways that we can do this as social scientists, ways that including use of the many tools available to us on the Internet, and ways that make partnering with community representatives and stakeholders as painless, inexpensive, and rewarding as possible.

I don't know if anyone will read this, but I'm looking for people to partner with to work on this project.  I have an idea to start us off with that I believe would be effective. 

If you think you might be interested, please let me know.  Eventually, I want to publish a paper about the development of the model and the data collected about its effectiveness during testing.  At the least, I want to publish it in the "grey literature" (websites and other self-publishing media).

Monday, March 5, 2012

RESOURCES: Research Links and Resources - Planned Parenthood - Heartland


Research Links and Resources - Planned Parenthood

Research Links and Resources


We've compiled a list of links to useful websites for educational information, statistics and research materials below.

Abortion


Abstinence


Contraception


Disability & Sexuality


Lesbian, Gay, Bisexual, Transgender (LGBT)


Parenting Information


Planned Parenthood Information & History


Reproductive Issues


Sexually Transmitted Infections (STI’s)


Sexuality Information for Teens


Teen Pregnancy Information

• National Campaign to Prevent Teen Pregnancy
• The Alan Guttmacher Institute
• National Center for Health Statistics
• SIECUS
• Resource Center for Adolescent Pregnancy Prevention

Saturday, October 29, 2011

The Social Work Wiki Project


Social Work WikiProject

'via Blog this'

Thursday, October 13, 2011

Who Rules America: Wealth, Income, and Power

Who Rules America: Wealth, Income, and Power:


Do Americans know their country's wealth distribution?

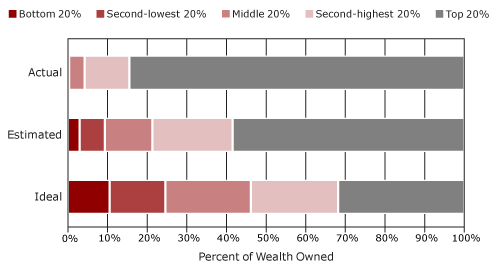
A remarkable study (Norton & Ariely, 2010) reveals that Americans have no idea that the wealth distribution (defined for them in terms of "net worth") is as concentrated as it is. When shown three pie charts representing possible wealth distributions, 90% or more of the 5,522 respondents -- whatever their gender, age, income level, or party affiliation -- thought that the American wealth distribution most resembled one in which the top 20% has about 60% of the wealth. In fact, of course, the top 20% control about 85% of the wealth (refer back to Table 1 and Figure 1 in this document for a more detailed breakdown of the numbers).
Even more striking, they did not come close on the amount of wealth held by the bottom 40% of the population. It's a number I haven't even mentioned so far, and it's shocking: the lowest two quintiles hold just 0.3% of the wealth in the United States. Most people in the survey guessed the figure to be between 8% and 10%, and two dozen academic economists got it wrong too, by guessing about 2% -- seven times too high. Those surveyed did have it about right for what the 20% in the middle have; it's at the top and the bottom that they don't have any idea of what's going on.
Americans from all walks of life were also united in their vision of what the "ideal" wealth distribution would be, which may come as an even bigger surprise than their shared misinformation on the actual wealth distribution. They said that the ideal wealth distribution would be one in which the top 20% owned between 30 and 40 percent of the privately held wealth, which is a far cry from the 85 percent that the top 20% actually own. They also said that the bottom 40% -- that's 120 million Americans -- should have between 25% and 30%, not the mere 8% to 10% they thought this group had, and far above the 0.3% they actually had. In fact, there's no country in the world that has a wealth distribution close to what Americans think is ideal when it comes to fairness. So maybe Americans are much more egalitarian than most of them realize about each other, at least in principle and before the rat race begins.
Figure 4, reproduced with permission from Norton & Ariely's article in Perspectives on Psychological Science, shows the actual wealth distribution, along with the survey respondents' estimated and ideal distributions, in graphic form.

Figure 4: The actual United States wealth distribution plotted against theestimated and ideal distributions.
Note: In the "Actual" line, the bottom two quintiles are not visible because the lowest quintile owns just 0.1% of all wealth, and the second-lowest quintile owns 0.2%.
Source: Norton & Ariely, 2010.

David Cay Johnston, a retired tax reporter for the New York Times, published an excellent summary of Norton & Ariely's findings (Johnston, 2010b; you can download the article from Johnston's Web site).

'via Blog this'

Tuesday, July 12, 2011

Resiliency Discussion by Dr. Joan Borysenko with Cheryl Richardson

Listen and download the podcast here!

Listen to Special Guests | Cheryl Richardson: "Monthly Telegathering with Dr. Joan Borysenko November 30, 2009. The book is called It’s Not the End of the World: Developing Resilience in Times of Change. Hear the extraordinary story of how Joan found resilience after a family tragedy, and was able to shift gears and begin a whole new line of work that has helped thousands of people. And, learn how to develop this kind of powerful resilience, too!"

Dr. Borysenko points out that resilience research shows some components of resiliency come from the characteristics of:

1. Realism
  • Have you ever thought that maybe a pessimist is a disappointed optimist or idealist?
  • "Pessimist complain about the wind. Optimists expect the wind to change. Realists adjust the sails."
  • Optimists tend to possess very little resiliency.

2. Faith
An openness to live in the moment.

3. Creativity

Tuesday, May 24, 2011

CDC: Developmental Disabilities Affect 1 In 7 U.S. Kids : Shots - Health Blog : NPR

A survey of American parents finds the prevalence of developmental disabilities has increased.

CDC: Developmental Disabilities Affect 1 In 7 U.S. Kids : Shots - Health Blog : NPR

Not only is ADHD disabling, but it's developmentally disabling, as well.

A couple of students in my MSW class debated that ADHD is not disabling. "It's simply a matter of learning skills to work around it." Well, most challenges are, no? However, how does this answer the question of how to deal with this neurological disorder? And, yes, it's definitely neurological, as well.

Monday, May 9, 2011

GOOGLE.ORG Tools for Non-Profits!


from
Google's Philanthropy Arm
"You’re changing the world. We want to help."
Apply for the Google for Nonprofits program and get access to exclusive products and resources to help your organization expand its impact.Learn more about whether your organization is eligible and apply today.

from the Google Nonprofits Blog
Google Apps Highlights , Announcing The Google Earth Outreach Developer Grants Program

Research with GOOGLE DOCS Data Collection & Analysis

Google

from the great people at Google Docs! THANK YOU!

Monday, April 12, 2010

SWB / Happiness : Variables Which Are Correlated refined

Based on DeNeve and Cooper's (1998). The happy personality: A meta-analyses of 137 personality traits and subjective well-being. Psychological Bulletin, 124, 197-229 findings:

The highest correlates with subjective well-being are:
  1. r=.30 Personality traits, namely trust, emotional stability (neuroticism?), desire for control, hardiness, locus of control-chance (believing events happen by chance), and tension (experiencing negative emotions).
  2. r=.29 Affiliation (wanting to relate to others)
  3. r=.29 Perceived Control
  4. r=-.27 Neuroticism
  5. r=.25 Internal Locus of Control (crediting or blaming self for events that happen)
  6. r=.23 Social Desirability (responding in a manner one believes will lead to approval from others)
  7. r=.20 Sociability (relating well with others)
  8. r=.20 Extraversion
From Lykken & Tellegran. (1996). Happiness is a stochastic phenomenon. American Psychological Society, 7(3), 186-189
  • Genetics also account for 80% of stable SWB

From Lucas, Richard E.; Fujita , Frank (2000). Factors influencing the relation between extraversion and pleasant affect.Journal of Personality and Social Psychology, Vol 79(6), Dec, 2000. pp. 1039-1056.
  • Extraversion (r=.38 and up to .80 when other variables controlled for)
From DeNeve & Cooper (1998)
  • Conscientiousness (r=.20)

Tuesday, April 6, 2010

SPSS Guide: Counting Responses with Frequency Tables

Using a sample of 25 children's responses about their favorite cereals.  The comma delimited data set is available below.

1a. What percentage are males? Females?


          61.54% are male, 34.62% are female.  It looks like, in this data, that one gender value was coded as "1" which is a mistake, and which adds a value to the 25 to equal 26.

1b. Which cereal was preferred by most children?


Data File in comma delimited format:

Cereal,Like,Gift,Gender
Ghostly Shadows,crazy,squirt gun,M
Ghostly Shadows,Like,squirt gun,M
Ghostly Shadows,not part,squirt gun,M
Canary Crunch,not part,ring,M
Turtle Treats,crazy,squirt gun,F
Turtle Treats,crazy,ring,F
Turtle Treats,Like,ring,F
Ghostly Shadows,crazy,ring,m
Canary Crunch,not part,squirt gun,F
Turtle Treats,crazy,squirt gun,F
Ghostly Shadows,Like,ring,F
Canary Crunch,not part,squirt gun,F
Turtle Treats,Like,ring,M
Ghostly Shadows,crazy,whistle,F
Canary Crunch,don't know,ring,M
Turtle Treats,crazy,whistle,F
Turtle Treats,Like,ring,F
Ghostly Shadows,Like,squirt gun,F
Turtle Treats,Like,ring,F
Turtle Treats,crazy,can't decide,M
Canary Crunch,Like,ring,F
Turtle Treats,crazy,squirt gun,M
Ghostly Shadows,Like,ring,F
Turtle Treats,Like,ring,F
Turtle Treats,crazy,ring,F