Showing posts with label data. Show all posts

Monday, May 21, 2012

Quit Smoking NOW: Smokefree.gov Resources

Smokefree.gov: Reasons for Quitting

Smokefree.gov: Smoking Triggers

Smokefree.gov: Putting a Stop to Smoky Thinking


Clearing the Air (2011) - Smokefree.gov's Online Guide to Quitting
for all smokers interested in quitting
  
Clearing the Air This booklet is designed to help you at any stage—whether you’re still thinking about quitting, have made the decision to quit, or have already taken steps to quit and just need help maintaining your new lifestyle. Both ex-smokers and experts have contributed to this guide. Clearing the Air can help people at all stages make it to their final goal—living smokefree.
AVAILABLE AS PDF TO SAVE OR PRINT, TOO!  


Forever Free™ (2011)
for smokers who have recently quit

Forever Free™ Congratulations! You’ve made the decision to stop smoking, and have taken real steps to quit. Now comes the next step: Staying smokefree. People who quit smoking initially fight to overcome their body’s addiction to the drug nicotine. But afterward, they still face challenges that can tempt them to smoke. Forever Free™ includes eight booklets that describe these challenges and ways to deal with them without smoking. Among the topics are controlling weight gain, dealing with stress, and what to do if you have that first cigarette.
AVAILABLE AS PDF TO SAVE OR PRINT, TOO!  


Forever Free for Baby and Me™ (2004)

for pregnant smokers who have recently quit

Forever Free for Baby and Me™ Congratulations on quitting smoking! You have taken one of the most important health steps that a woman can take. The fact that you asked for Forever Free for Baby and Me means that you want to stay smokefree for you, your baby, and your family. You can succeed! Your commitment, along with the Forever Free for Baby and Me booklets, should increase your chance of success!
AVAILABLE AS PDF TO SAVE OR PRINT, TOO!  

Libres Para Siempre por mi Bebé y por Mí™(2004)

para fumadoras embarazadas que han dejado de fumar recientemente

Libres Para Siempre por mi Bebé y por Mí™ ¡Felicidades por dejar de fumar! Usted ha dado uno de los pasos más importantes que una mujer puede dar. El hecho de haber pedido información sobre "Libres para siempre por mi bebé y por mí" significa que desea vivir sin fumar: por su bien, el de su bebé y el de su familia. ¡Puede lograrlo! ¡Ese compromiso y los folletos de "Libres para siempre por mi bebé y por mí" mejorarán sus probabilidades de éxito!
AVAILABLE AS PDF TO SAVE OR PRINT, TOO!  

Guía: Viva de forma más saludable para usted y su familia, deje de fumar hoy mismo (2011)

para fumadores de habla hispana
 Order free paper copy
Guía: Viva de forma más saludable para usted y su familia, deje de fumar hoy mismo El número de habitantes de habla hispana está aumentando rápidamente y, pronto, ellos llegarán a ser el segundo grupo étnico más grande en los Estados Unidos. Junto con este crecimiento, hay una necesidad mayor de materiales en español que podrían ayudar a la población de habla hispana a dejar de fumar y ha mantenerse así. Escritas para quienes piensan dejar de fumar o quienes ya han dejado de fumar, estas 44 páginas están llenas de fotos, dibujos llamativos y contenido que se basa en la cultura hispana.
AVAILABLE AS PDF TO SAVE OR PRINT, TOO!  

Pathways to Freedom

for African American smokers
Pathways to FreedomThis guide was developed to address the national concern over the high rates of smoking among the African-American population. This updated edition (2003) offers proven strategies for anyone who wants to quit; how friends and family can help, and how the community and its leaders can promote the value of gaining freedom from tobacco.
AVAILABLE AS PDF TO SAVE OR PRINT, TOO!  

Smokeless Tobacco: A Guide for Quitting

for young men who have decided to quit using spit tobacco
  
Smokeless Tobacco: A Guide for QuittingThis booklet is designed specifically for young men who have decided to quit using spit tobacco or who are thinking about quitting. It includes reasons to quit, addresses myths about spit tobacco, and helps the reader develop a plan for quitting.
AVAILABLE AS PDF TO SAVE OR PRINT, TOO!

Fact Sheets and FAQs

for smokers and non-smokers looking to learn about the impact of smoking

Fact Sheets and FAQs19 Fact Sheets and set of Frequently Asked Questions (FAQ) providing information about cigarettes and other tobacco products, environmental tobacco smoke, and additional topics. 
AVAILABLE AS PDF TO SAVE OR PRINT, TOO! 

Monday, April 30, 2012

Smokefree Women: Smoking in Your State: Data View

Smokefree Women: Smoking in Your State: Data View


Smoking in Your State: Data View

StatePercentage of Adults That SmokePack PricePack Price RankSmoking Percentage RankWork Ban?Bar Ban?Restaurant Ban?
United States20.65.51----nonono
Alaska20.67.018th12thnonono
Alabama22.54.4248th7thnonono
Arkansas21.45.2228th11thyesnono
Arizona16.16.2012th40thyesyesyes
California12.85.0929th50thyesyesyes
Colorado17.04.8832nd35thyesyesyes
Connecticut15.47.315th43rdyesyesyes
Washington, DC15.26.5610th45thyesyesyes
Delaware18.24.9930th23rdyesyesyes
Florida18.15.4021st24thyesnoyes
Georgia17.64.4446th30thnonono
Hawaii15.37.563rd44thyesyesyes
Iowa17.15.2627th34thyesyesyes
Idaho16.34.5343rd39thnonoyes
Illinois18.55.5718th22ndyesyesyes
Indiana23.14.8234th5thnonono
Kansas17.84.7236th29thyesyesyes
Kentucky25.64.5540th1stnonono
Louisiana22.04.4049th10thyesnoyes
Massachusetts14.97.047th49thyesyesyes
Maryland15.16.1113th46thyesyesyes
Maine17.26.0814th32ndyesyesyes
Michigan19.66.0415th18thyesyesyes
Minnesota16.75.2725th37thyesyesyes
Missouri23.13.9751st6thnonono
Mississippi23.34.5540st4thnonono
Montana16.85.3623rd36thyesyesyes
North Carolina20.34.5540nd14thnoyesyes
North Dakota18.64.1450th21styesnono
Nebraska16.74.6438th38thyesyesyes
New Hampshire15.75.4620th42ndyesyesyes
New Jersey15.87.066th41styesyesyes
New Mexico17.95.7916th26thyesyesyes
Nevada22.04.9531st8thyesnoyes
New York17.98.971st25thyesyesyes
Ohio20.35.3024th13thyesyesyes
Oklahoma25.44.8633rd3rdnonono
Oregon17.84.7635th28thyesyesyes
Pennsylvania20.25.3922nd16thyesnono
Rhode Island15.07.632nd47thyesyesyes
South Carolina20.34.4944th15thnonono
South Dakota17.45.2725th31styesyesyes
Tennessee22.04.7236th9thnonono
Texas17.95.4719th27thnonono
Utah9.85.7017th51styesyesyes
Virginia19.04.4446th19thnonono
Vermont17.16.5311th33rdyesyesyes
Washington14.97.544th48thyesyesyes
Wisconsin18.76.729th20thyesyesyes
West Virginia25.54.4944th2ndnonono
Wyoming19.94.5639th17thnonono

Tuesday, April 17, 2012

Quit Smoking NOW Resources: Identify Your Triggers

Smoking Triggers

What are your "triggers"?
Certain things trigger, or turn on, your need for a cigarette. They can be moods, feelings, places, or things you do. Knowing your triggers helps you stay in control. Put a check next to things that tempt you to smoke:
Feeling stressed
Feeling down
Talking on the phone
Drinking liquor, like wine or beer
Watching TV
Driving
Finishing a meal
Playing cards
Taking a work break
Being with other smokers
Drinking coffee
Seeing someone else smoke
Cooling off after a fight
Feeling lonely
After having sex
My other triggers are:
___________________________________________________________________
___________________________________________________________________
___________________________________________________________________
via: SmokeFree.gov

Tuesday, March 20, 2012

Quit Smoking NOW Resources: Identify Reasons for Quitting

Reasons for Quitting

Here are some examples of reasons to quit:
I will feel healthier right away. I will have more energy and better focus. My senses of smell and taste will be better. I will have whiter teeth and fresher breath. I will cough less and breathe better.
I will be healthier the rest of my life. I will lower my risk for cancer, heart attacks, strokes, early death, cataracts, and skin wrinkling.
I will make my partner, friends, family, kids, grandchildren, and co-workers proud of me.
I will be proud of myself. I will feel more in control of my life. I will be a better role model for others.
I will no longer expose others to my second-hand smoke.
I will have a healthier baby. (If you or your partner is pregnant)
I will have more money to spend.
I won't have to worry: "When will I get to smoke next?" or "What do I do when I'm in a smokefree place?"
My other reasons are:
__________________________________________________________
__________________________________________________________
_________________________________________________________
via SmokeFree.gov_

Saturday, October 29, 2011

The Social Work Wiki Project


Social Work WikiProject

'via Blog this'

Thursday, October 13, 2011

Who Rules America: Wealth, Income, and Power

Who Rules America: Wealth, Income, and Power:


Do Americans know their country's wealth distribution?

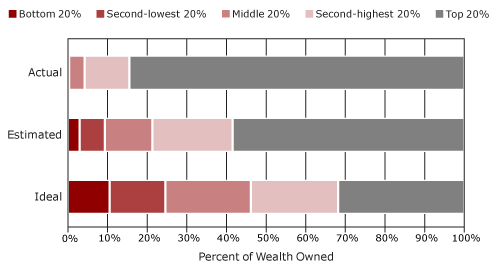
A remarkable study (Norton & Ariely, 2010) reveals that Americans have no idea that the wealth distribution (defined for them in terms of "net worth") is as concentrated as it is. When shown three pie charts representing possible wealth distributions, 90% or more of the 5,522 respondents -- whatever their gender, age, income level, or party affiliation -- thought that the American wealth distribution most resembled one in which the top 20% has about 60% of the wealth. In fact, of course, the top 20% control about 85% of the wealth (refer back to Table 1 and Figure 1 in this document for a more detailed breakdown of the numbers).
Even more striking, they did not come close on the amount of wealth held by the bottom 40% of the population. It's a number I haven't even mentioned so far, and it's shocking: the lowest two quintiles hold just 0.3% of the wealth in the United States. Most people in the survey guessed the figure to be between 8% and 10%, and two dozen academic economists got it wrong too, by guessing about 2% -- seven times too high. Those surveyed did have it about right for what the 20% in the middle have; it's at the top and the bottom that they don't have any idea of what's going on.
Americans from all walks of life were also united in their vision of what the "ideal" wealth distribution would be, which may come as an even bigger surprise than their shared misinformation on the actual wealth distribution. They said that the ideal wealth distribution would be one in which the top 20% owned between 30 and 40 percent of the privately held wealth, which is a far cry from the 85 percent that the top 20% actually own. They also said that the bottom 40% -- that's 120 million Americans -- should have between 25% and 30%, not the mere 8% to 10% they thought this group had, and far above the 0.3% they actually had. In fact, there's no country in the world that has a wealth distribution close to what Americans think is ideal when it comes to fairness. So maybe Americans are much more egalitarian than most of them realize about each other, at least in principle and before the rat race begins.
Figure 4, reproduced with permission from Norton & Ariely's article in Perspectives on Psychological Science, shows the actual wealth distribution, along with the survey respondents' estimated and ideal distributions, in graphic form.

Figure 4: The actual United States wealth distribution plotted against theestimated and ideal distributions.
Note: In the "Actual" line, the bottom two quintiles are not visible because the lowest quintile owns just 0.1% of all wealth, and the second-lowest quintile owns 0.2%.
Source: Norton & Ariely, 2010.

David Cay Johnston, a retired tax reporter for the New York Times, published an excellent summary of Norton & Ariely's findings (Johnston, 2010b; you can download the article from Johnston's Web site).

'via Blog this'

Friday, August 12, 2011

The No FEAR Act AGAINST Discrimination in Federal Agencies Information & Data

Here is a link to the No FEAR Act information at the US Postal Service's website:
The “Notification and Federal Employee Antidiscrimination and Retaliation Act of 2002,” Public Law 107-174, which is now known as the No FEAR Act, became effective October 1, 2003. This law seeks to decrease violations of antidiscrimination laws by increasing the accountability of federal agencies for violations of those laws. Among other things, it requires federal agencies to post EEO statistics on their web sites and to educate their employees about the rights and remedies under the antidiscrimination and whistleblower laws that apply to them.

The USPS is committed to having a workplace environment that is free from discrimination. Please view the USPS EEO statistics required under the No FEAR Act that are contained in the links below. Further information regarding the No FEAR Act, including the No FEAR Act Notice to USPS employees and applicants for employment, is also provided in the links below.


Tuesday, May 24, 2011

CDC: Developmental Disabilities Affect 1 In 7 U.S. Kids : Shots - Health Blog : NPR

A survey of American parents finds the prevalence of developmental disabilities has increased.

CDC: Developmental Disabilities Affect 1 In 7 U.S. Kids : Shots - Health Blog : NPR

Not only is ADHD disabling, but it's developmentally disabling, as well.

A couple of students in my MSW class debated that ADHD is not disabling. "It's simply a matter of learning skills to work around it." Well, most challenges are, no? However, how does this answer the question of how to deal with this neurological disorder? And, yes, it's definitely neurological, as well.

Monday, May 9, 2011

GOOGLE.ORG Tools for Non-Profits!


from
Google's Philanthropy Arm
"You’re changing the world. We want to help."
Apply for the Google for Nonprofits program and get access to exclusive products and resources to help your organization expand its impact.Learn more about whether your organization is eligible and apply today.

from the Google Nonprofits Blog
Google Apps Highlights , Announcing The Google Earth Outreach Developer Grants Program

Research with GOOGLE DOCS Data Collection & Analysis

Google

from the great people at Google Docs! THANK YOU!

Monday, April 12, 2010

SWB / Happiness : Variables Which Are Correlated refined

Based on DeNeve and Cooper's (1998). The happy personality: A meta-analyses of 137 personality traits and subjective well-being. Psychological Bulletin, 124, 197-229 findings:

The highest correlates with subjective well-being are:
  1. r=.30 Personality traits, namely trust, emotional stability (neuroticism?), desire for control, hardiness, locus of control-chance (believing events happen by chance), and tension (experiencing negative emotions).
  2. r=.29 Affiliation (wanting to relate to others)
  3. r=.29 Perceived Control
  4. r=-.27 Neuroticism
  5. r=.25 Internal Locus of Control (crediting or blaming self for events that happen)
  6. r=.23 Social Desirability (responding in a manner one believes will lead to approval from others)
  7. r=.20 Sociability (relating well with others)
  8. r=.20 Extraversion
From Lykken & Tellegran. (1996). Happiness is a stochastic phenomenon. American Psychological Society, 7(3), 186-189
  • Genetics also account for 80% of stable SWB

From Lucas, Richard E.; Fujita , Frank (2000). Factors influencing the relation between extraversion and pleasant affect.Journal of Personality and Social Psychology, Vol 79(6), Dec, 2000. pp. 1039-1056.
  • Extraversion (r=.38 and up to .80 when other variables controlled for)
From DeNeve & Cooper (1998)
  • Conscientiousness (r=.20)

Thursday, March 25, 2010

Statistical Terminology: Why different statistics are used


Descriptive Statistics

Mean: a measure of the general tendency, calculated by adding all the scores and dividing by the number of scores. The advantage over other measures of tendency is that it uses all scores; disadvantage is that it's influenced by extreme scores. It should be used with interval or ratio levels of measurement.
Mode: A measure of central tendency which is the most frequently occurring score in a distribution.
Median: A measure of central tendency that is the middle score of a set , placed in size order. Advantage: not influenced by extremes; Disadvantage: it doesn't use the arithmetic values of the intervals between scores. It requires an ordinal level of measurement and should be used instead of the mean when the distribution of data on an interval scale is skewed.
Standard Deviation: The square root of the variance. It measures the dispersion of the scores around the mean in a normal distribution.
Variance: A measure of dispersion that is eq. to the sum of the squares divided by the degrees of freedom.
Range: Simplest measure of dispersion; measuring the difference b/n the highest and lowest scores. Sometimes the value 1 is added to the difference to reflect that the range is inclusive of the end points.

Inferential Statistics

t-test: finds the difference b/n means b/n two groups. In a one-sample t-test, observed mean is compared to expected mean of the population.
ANOVA (Analysis of Variance): tests for sig. diff. b/n the means. Same results as t-test.
Repeated Measures ANOVA: successive observations from the same source (dog, or person, such as in a longitudinal study). Another e.g. is when the same person is given a treatment of vodka then tested on memory, then comes back in 5 days and is given a placebo.
Correlation: measure of the relation between two or more variables. Correlation coefficients range from -1.00 (perfect negative correlation - negative correlation!) to +1.00 (perfect positive correlation). A correlation of 0.00 means A LACK OF CORRELATION.
Multiple Regression: analyzes the relationship between several independent (or predictor) variables and a dependent (or criterion) variable.
Factor Analysis: reduces the number of variables, and then detect the structure of relationships between varaibles -- that is, to classify the variables. E.g., if we are set to measure people's satisfaction, and ask in a survey how much they like their hobbies and also how much time they spend on their hobbies, the two varaiable will probably have a HIGH correlation, which mean we are probably being redundant with both variables - best to condense.
One can summarize the correlation between two variables in a scatterplot. A regression line can then be fitted that represents the "best" summary of the linear relationship between the variables. If we could define a variable that would approximate the regression line in such a plot, then that variable would capture most of the "essence" of the two items. Subjects' single scores on that new factor, represented by the regression line, could then be used in future data analyses to represent that essence of the two items. In a sense we have reduced the two variables to one factor.
Discriminant Analysis: used to discriminate between two or more naturally-occurring groups. E.g., a school researcher may try to find out which variables differ b/n groups of students who decide to go to college and those who don't, and figure out which variables (SAT score, GPA, etc) predict each.
Chi Square Test: A test that uses the chi-square statistic to test the fit between a theoretical frequency distribution and a frequency distribution of observed data for which each observation may fall into one of several classes.
f(x) = {1/[2/2 * (/2)]} * [x(/2)-1 * e-x/2]

= 1, 2, ..., 0 <>

where
is the degrees of freedom
e is the base of the natural logarithm, sometimes called Euler's e (2.71...)
(gamma) is the Gamma function